2024 Real Worth Stocks portfolio performance and thoughts for 2025
In this article I will break down the performance of my portfolio vs the S&P 500 in 2024. The S&P 500 was chosen as it had the best performance of all the main equity markets in 2024.
2024 returns:
Real Worth Stocks time-weighted portfolio return +15%
S&P 500 return +25%
FTSE-250 in the UK return +8%
Real Worth stocks portfolio 15% total gain breakdown:
40% unrealised capital net gains
50% capital distribution from Asian Energy Impact Trust (AEIT) liquidation
10% dividends
Unrealised capital gains:
Two of the largest unrealised capital gains came from stock picks in November and December 2024. Three other stocks contributed most of the rest of the capital gains, one of which was Axos Financial (AX).
This performance all came from stocks outside the S&P 500 except for one: Ulta Beauty, which makes up only 1.4% of the portfolio.
Comparison with the S&P 500:
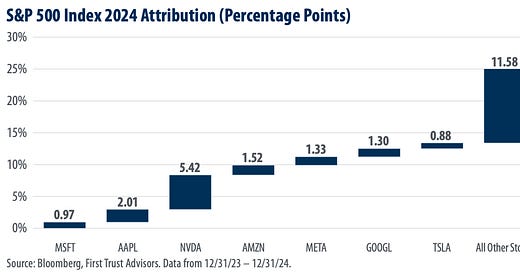
The S&P 500’s 25% gain can be broken down into a 50% gain from the ‘Magnificent Seven,’ stocks, and 50% to the rest of the stocks in the index as below.
The S&P 500 P/E ratio at the end of 2024 is about 28x, up from 25x at the start of the year. About 50% of the return of the S&P 500 has come from earnings growth, and 40% from multiple expansion, with 10% being from dividends.
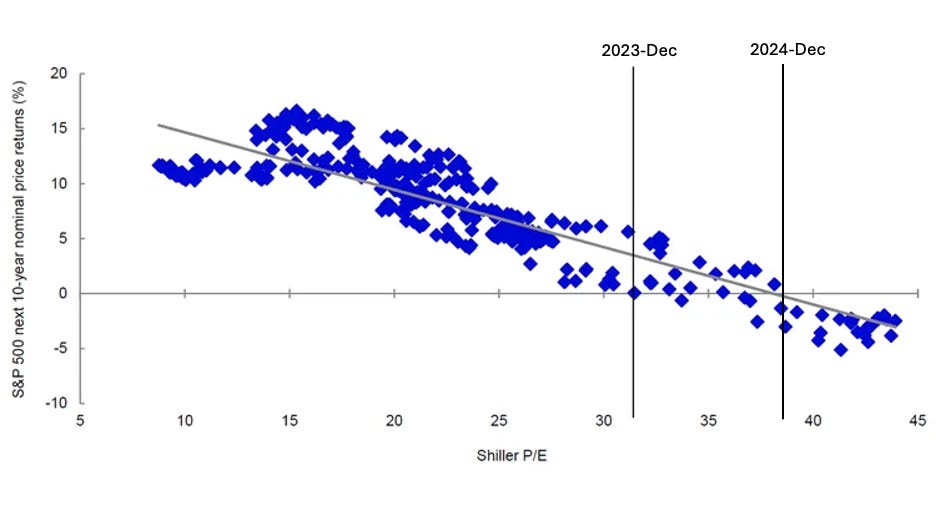
Below: 10-year future returns for the S&P 500 since 1983 based on the Schiller P/E - (which is based on average of earnings in the ten prior years)
The chart above shows a remarkable correlation of the average returns over the future 10 years for the S&P 500, based on the Schiller P/E ratio. Two vertical lines are appended to the chart: the first at a Schiller P/E ratio of 32x for Dec-23, and the second for at a Schiller P/E ratio of 38x at Dec-24.
In a nutshell: the S&P 500 is currently at a high Schiller P/E ratio, and if the historical trends for the last 40 years hold as above, near zero or negative nominal returns can be expected for the S&P 500 over the next decade, i.e. a breakeven or real terms loss to 2035.
Real Worth Stocks portfolio current P/E ratio and earnings growth
I am not able to calculate a Schiller P/E ratio for the Real Worth Stocks portfolio, but the weighted average P/E ratio of the portfolio is currently 12x.
The weighted average earnings growth for the Real Worth Stocks portfolio is 28% earnings growth per year - calculated from 10 year earning figures, or the maximum number of years available if less. Revenue growth weighted average is 22% per year.
Risk-reward ratio:
At current S&P 500 levels, the risk-reward ratio is not very good: if the market should revert to the long-term average of around Shiller P/E ratio of 15, this would be a 50% drawdown in the market. However, I consider this unlikely since the ratio has been above this level for the last 30 years or so: but even if it just declined to 20x, this would still be a 1/3 drop in the S&P 500. The trigger for such a decline could be a recession - in this case, if earnings dropped also, the decline could be more severe. Of course, earnings are likely to gradually increase over time, and predicting the timing and severity of market drawdowns is very difficult, if not impossible. What can be said with confidence is that the likelihood of poor future returns increases significantly as the market P/E multiples increase, and they are now at long term highs.
Conclusion:
The Real Worth Stocks portfolio is positioned to have percentage revenue and earnings growth more than double the long term percentage price return of the S&P 500, and is priced at ~1/3 the P/E ratio of the S&P 500, which should protect it in the face of any market shocks. I will continue to pick ten new stocks per year that offer good risk-reward for shareholders, with full portfolio reviews every 6 months on every stock in the portfolio, as to whether to buy or hold, and update on news affecting the stocks.


